 |
| Related Articles |
|
|
The Department of Energy and Climate Change (DECC) has today (14th July) published the latest Annual Report on Fuel Poverty Statistics 2011. The headline figures refer to fuel poverty levels in the UK and England in 2009.
A household is said to be in fuel poverty if it needs to spend more than 10 per cent of its income on fuel to maintain an adequate level of warmth (usually defined as 21 degrees for the main living area, and 18 degrees for other occupied rooms).
The report includes the following highlights:
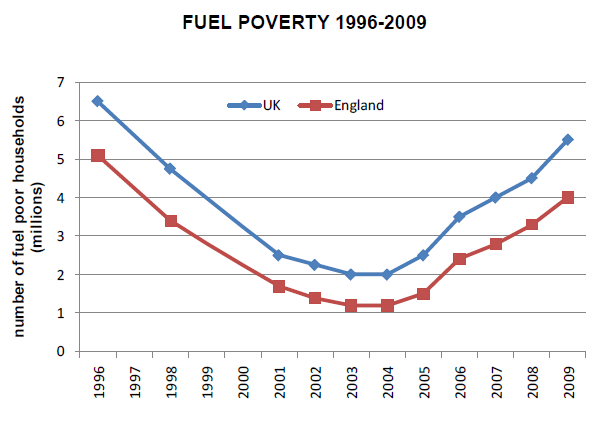
- In 2009, there were around 5.5 million fuel poor households in the UK, up from 4.5 million in 2008. In England, there were around 4.0 million fuel poor households, up from 3.3 million in 2008.
- The increase in fuel poverty between 2008 and 2009 was largely due to rising fuel prices. Gas prices rose by 14 per cent, and electricity prices by 5 per cent, between 2008 and 2009.
- Rising incomes, improvements in the energy efficiency of housing and social and discounted tariffs continue to help some households from falling into fuel poverty and, in some cases, have removed households from fuel poverty.
- Fuel poverty amongst vulnerable households for 2009 stood at 4.5 million households (UK), up 0.75 million from 2008, and 3.2 million households (England), up 0.5 million from 2008. A vulnerable household is one that contains the elderly, children or somebody who is disabled or long term sick.
- Fuel poverty figures are calculated across two years, and so price and income changes for two years need to be considered when looking at these figures. Projections for England indicate there are likely to be around 4.0 million fuel poor households in 2010 and 4.1 million households in 2011. Although some price rises will impact on households in the latter half of 2011, it will be 2012 before the full impact of these are visible in the fuel poverty data.
- Actual fuel poverty figures for 2010 and 2011 will only be known when we have detailed results of the surveys on household income and efficiency programmes, and will be available for publication in 2011 and 2012 respectively.
- The report also contains chapters looking at trends in fuel poverty over time, detailed analysis of drivers of fuel poverty, and future developments.
The report PDF is available here. Also released today:
- Fuel Poverty Monitoring – Indicators 2011
This is an internet-only annex summarising a range of indicators on income, fuel prices and housing that can provide a useful background to consider alongside the Statistics Report. PDF available here. - Fuel Poverty 2009 – Detailed Tables
This document presents a series of detailed tables analysing the headline fuel poverty statistics for 2009, published on the internet. PDF available here. - Trends in Fuel Poverty
This internet publication brings together detailed tables from 2003 to 2009 allowing detailed comparisons of fuel poverty over time. Excel file available at the DECC website here.


