(Update Notes: Updated with additional data from 4 local authorities with a total of 62 inspections.)
theEHP consistently reported on Local Authority prosecutions. As part of our 2012 review, we have carried out an analysis of Environmental Health prosecution.
 |
| [relatedPosts title=”Related Posts”] |
Before we get started, its necessary to set a number of ground rules for the analysis. These rules have been set for ease of analysis and presentation. theEHP values all prosecutions reported and the hard work of all local authority staff. The ground rules are detailed below:
- This analysis only includes prosecutions were fines and/ or costs were awarded.
- Only prosecutions carried out by environmental health departments are included. Therefore, HSE, planning and FSA prosecutions are excluded.
- This analysis includes prosecutions that were posted on the site between 1st January 2012 and 4th December 2012 (date of our last newsletter of 2012).
- The victims surcharge is excluded from the calculation
- Smoking prosecutions have been separated from Public Health prosecution because Public Health fines significantly lower.
- Local Authority prosecutions were divided into the following eight categories:
- Caravan Sites
- Environmental Protection
- Food Safety
- Health & Safety
- Housing
- Illegal Eviction & Harassment
- Public Health
- Smoking
Number of Prosecutions
In the period a total of 224 Environmental Health prosecutions were reported on theEHP. These were undertaken by 81 local authorities (average of 2.8 prosecutions per LA). 32 (40%) local authorities carried out more than one prosecution. The highest number of prosecutions carried out by a single local authority was 36 – Caerphilly County Borough Council. Table 1 below details the number of prosecutions carried out by all councils. For display purposes, there is a link to a list of councils that carried out 1 prosecution.
| Table 1 | ||
|
Number of Prosecutions |
Number of LAs |
LAs |
|
36 |
1 |
Caerphilly County Borough Council |
|
15 |
1 |
Salford City Council |
|
11 |
1 |
City of York Council |
|
10 |
1 |
Oxford City Council |
|
9 |
1 |
Luton Council |
|
7 |
2 |
Middlesbrough Council Newham Council |
|
6 |
1 |
Cornwall Council |
|
5 |
2 |
Camden Council Leeds City Council |
|
4 |
5 |
Basildon Council Cardiff Council North Kesteven District Council Pembrokeshire County Council Stockton Council |
|
3 |
10 |
Coventry City Council Ealing Council Haringey Council Hillingdon Council Huntingdonshire District Council Oldham Council Reading Borough Council Southend-on-Sea Borough Council Stafford Borough Council Swansea Council |
|
2 |
7 |
Belfast City Council Birmingham City Council Brighton & Hove City Council Crawley Borough Council Manchester City Council Warwick District Council Watford Borough Council |
|
1 |
49 |
List of LAs Available |
Fines, Costs, Totals & Averages – All Prosecutions
The 162 Environmental Health prosecutions resulted in a total of £2,095,823.40 fines and costs combined (hereafter referred to as ‘totals’). This figure was made up of £1,407,294.84 in fines and £578,811.56 in prosecution costs. The average fines, costs and totals are detailed in Table 2 below.
| Table 2 | |||
|
Average |
Min |
Max |
|
| Fines | £17,981.34 | £100.00 | £355,000.00 |
| Costs | £7,681.49 | £66.00 | £149,353.00 |
| Total | £25,782.39 | £166.00 | £504,353.00 |
Fines, Costs, Totals & Averages – By Category
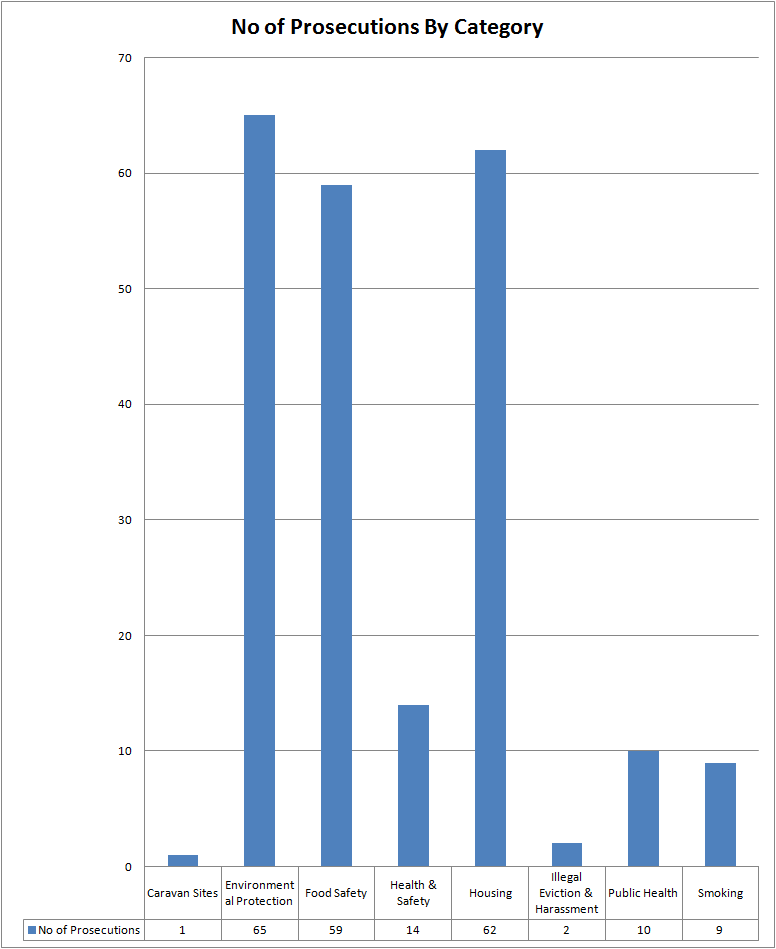
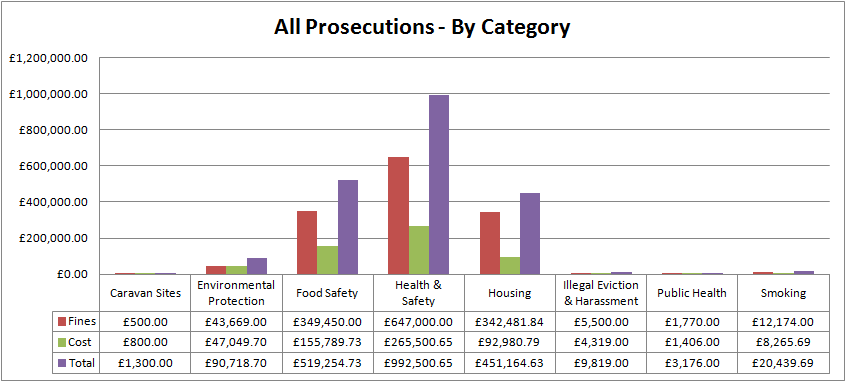
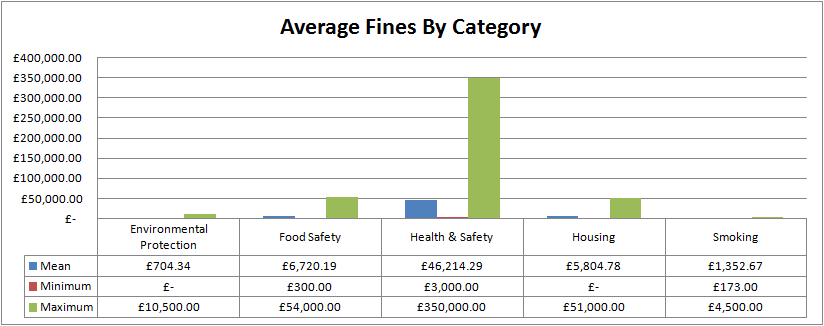
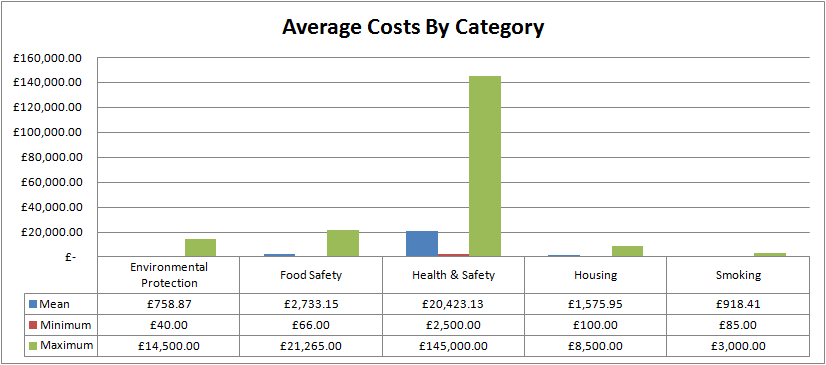
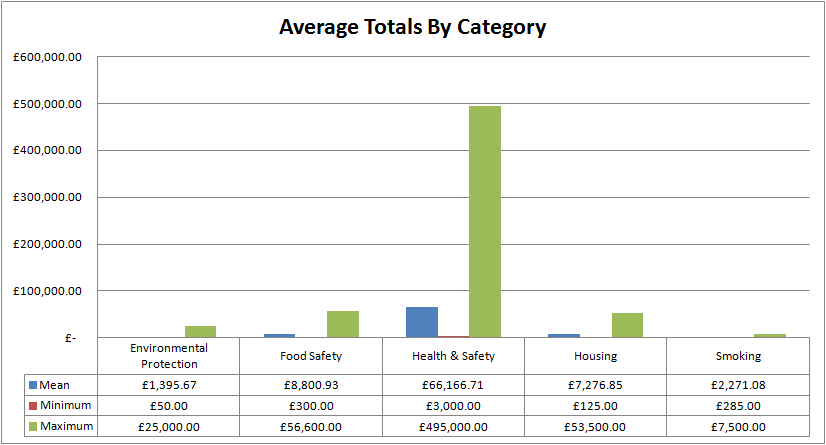
Table 3 below details the number of prosecutions, fines, costs and totals for each sector. Further analysis of the Environmental Protection, Food Safety, Health & safety and Housing categories are included below.
| Table 3 | ||||
| Category | Number of Prosecutions | Fines | Cost | Total |
| Caravan Sites |
1 |
£500.00 |
£800.00 |
£1,300.00 |
| Environmental Protection |
65 |
£43,669.00 |
£47,049.70 |
£90,718.70 |
| Food Safety |
59 |
£349,450.00 |
£155,789.73 |
£519,254.73 |
| Health & Safety |
14 |
£647,000.00 |
£265,500.65 |
£992,500.65 |
| Housing |
62 |
£342,481.84 |
£92,980.79 |
£451,164.63 |
| Illegal Eviction & Harassment |
2 |
£5,500.00 |
£4,319.00 |
£9,819.00 |
| Public Health |
10 |
£1,770.00 |
£1,406.00 |
£3,176.00 |
| Smoking |
9 |
£12,174.00 |
£8,265.69 |
£20,439.69 |
Environmental Protection
Environmental Protection prosecutions accounted for 29.0% (65) of all reported prosecutions.
- Fines accounted for 3.1% of all fines.
- Costs accounted for 8.2% of all costs.
- Totals accounted for 4.3% of all totals.
- The split between fines and cost were 48.8% and 51.2% respectively.
- Prosecution with the highest fine – Environmental Protection: Judgement on Elvington Airfield notice dispute
- Prosecution with the highest cost – Environmental Protection: Judgement on Elvington Airfield notice dispute
- Prosecution with the highest total – Environmental Protection: Judgement on Elvington Airfield notice dispute
Table 5 below details the averages for Environmental Protection prosecutions.
| Table 5 | |||
| Mean | Min | Max | |
| Fine | £704.34 | £0 | £10,500.00 |
| Cost | £758.87 | £40.00 | £14,500.00 |
| Total | £1,395.67 | £50.00 | £25,000.00 |
Food Safety
Food Safety prosecutions accounted for 26.3% (59) of all reported prosecutions.
- Fines accounted for 24.8% of all fines.
- Costs accounted for 26.9% of all costs.
- Totals accounted for 24.8% of all totals.
- The split between fines and cost were 67.3% and 32.7% respectively.
- Prosecution with the highest fine – Food Safety: £54,000 fine and ban for owners of ‘disgraceful’ restaurant
- Prosecution with the highest cost – Food Safety: Wolverhampton pub fined for unhygienic conditions
- Prosecution with the highest total – Food Safety: £54,000 fine and ban for owners of ‘disgraceful’ restaurant
Table 6 below details the averages for Food Safety prosecutions.
| Table 6 | |||
| Mean | Min | Max | |
| Fine | £6,720.19 | £300.00 | £54,000.00 |
| Cost | £2,733.15 | £66.00 | £21,265.00 |
| Total | £8,800.93 | £300.00 | £56,600.00 |
Health & Safety
Health & Safety prosecutions accounted for 6.3% (14) of all reported prosecutions.
- Fines accounted for 46.0% of all fines.
- Costs accounted for 45.9% of all costs.
- Totals accounted for 47.4% of all totals.
- The split between fines and cost were 65.2% and 34.8% respectively.
- Prosecution with the highest fine –Health & Safety: Warwick Castle to pay over £490k following fatal accident
- Prosecution with the highest cost –Health & Safety: Warwick Castle to pay over £490k following fatal accident
- Prosecution with the highest total –Health & Safety: Warwick Castle to pay over £490k following fatal accident
Table 7 below details the averages for Health & Safety prosecutions
| Table 7 | |||
| Mean | Min | Max | |
| Fine | £46,214.29 | £3,000.00 | £350,000.00 |
| Cost | £20,423.13 | £2,500.00 | £145,000.00 |
| Total | £66,166.71 | £3,000.00 | £495,000.00 |
Housing
Housing prosecutions accounted for 27.7% (62) of all reported prosecutions.
- Fines accounted for 24.3% of all fines.
- Costs accounted for 16.1% of all costs.
- Totals accounted for 21.5% of all totals.
- The split between fines and cost were 75.9% and 24.1% respectively.
- Prosecution with the highest fine – Housing: Massive fine for Luton landlord who let out ‘death trap’
- Prosecution with the highest cost – Housing: Norwich City landlord prosecuted
- Prosecution with the highest total – Housing: Norwich City landlord prosecuted
Table 8 below details the averages for Housing prosecutions.
| Table 8 | |||
| Mean | Min | Max | |
| Fine | £5,804.78 | £0 | £51,000.00 |
| Cost | £1,575.95 | £100.00 | £8,500.00 |
| Total | £7,276.85 | £125.00 | £53,500.00 |
theEHP Statistical Release 2013
To include your local authorities’ data in our next statistical release please forward details of your prosecutions to mark@theehp.com. If your local authority does not produce press releases for prosecutions, if you provide the following basic details your data can form part of our next release.
- Name of your LA
- Date of prosecution
- Name of person/ business prosecuted
- Type of prosecution (food safety, health & safety, housing, etc)
- Outline of the offence
- Fine
- Costs
- Total fine
We welcome any suggestions on how we can improve our statistical releases.
Further Information
Local Authorities who carried out one prosecution
| Aberdeenshire Council |
| Bath & North East Somerset Council |
| Bolsover District Council |
| Bracknell Forest Council |
| Bradford Council |
| Bromley Council |
| Cambridge City Council |
| Cherwell District Council |
| Cheshire West and Chester Council |
| Chesterfield Borough Council |
| Croydon Council |
| Darlington Borough Council |
| Greenwich Council |
| Halton Borough Council |
| Hammersmith & Fulham Council |
| Hull City Council |
| Ipswich Borough Council |
| Islington Council |
| Kingston Council |
| Lambeth Council |
| Leicester City Council |
| Liverpool City Council |
| Merton Council |
| Newark and Sherwood District Council |
| North Herts District Council |
| North Norfolk District Council |
| Norwich City Council |
| Nuneaton and Bedworth Borough Council |
| Plymouth City Council |
| Portsmouth City Council |
| Preston City Council |
| Purbeck District Council |
| Reigate & Banstead Borough Council |
| Richmond Council |
| Royal Borough of Greenwich |
| Rugby Borough Council |
| Sandwell Council |
| Scarborough Borough Council |
| Sheffield City Council |
| South Hams District Council |
| Southwark Council |
| Spelthorne Council |
| Teignbridge District Council |
| Three Rivers District Council |
| Thurrock Council |
| Wandsworth Council |
| Welwyn Hatfield Borough Council |
| Weymouth & Portland Borough Council |
| Wolverhampton City Council |
Additional Graphs
